
Why Your Pipeline Leaks (And How AI Diagnoses It)
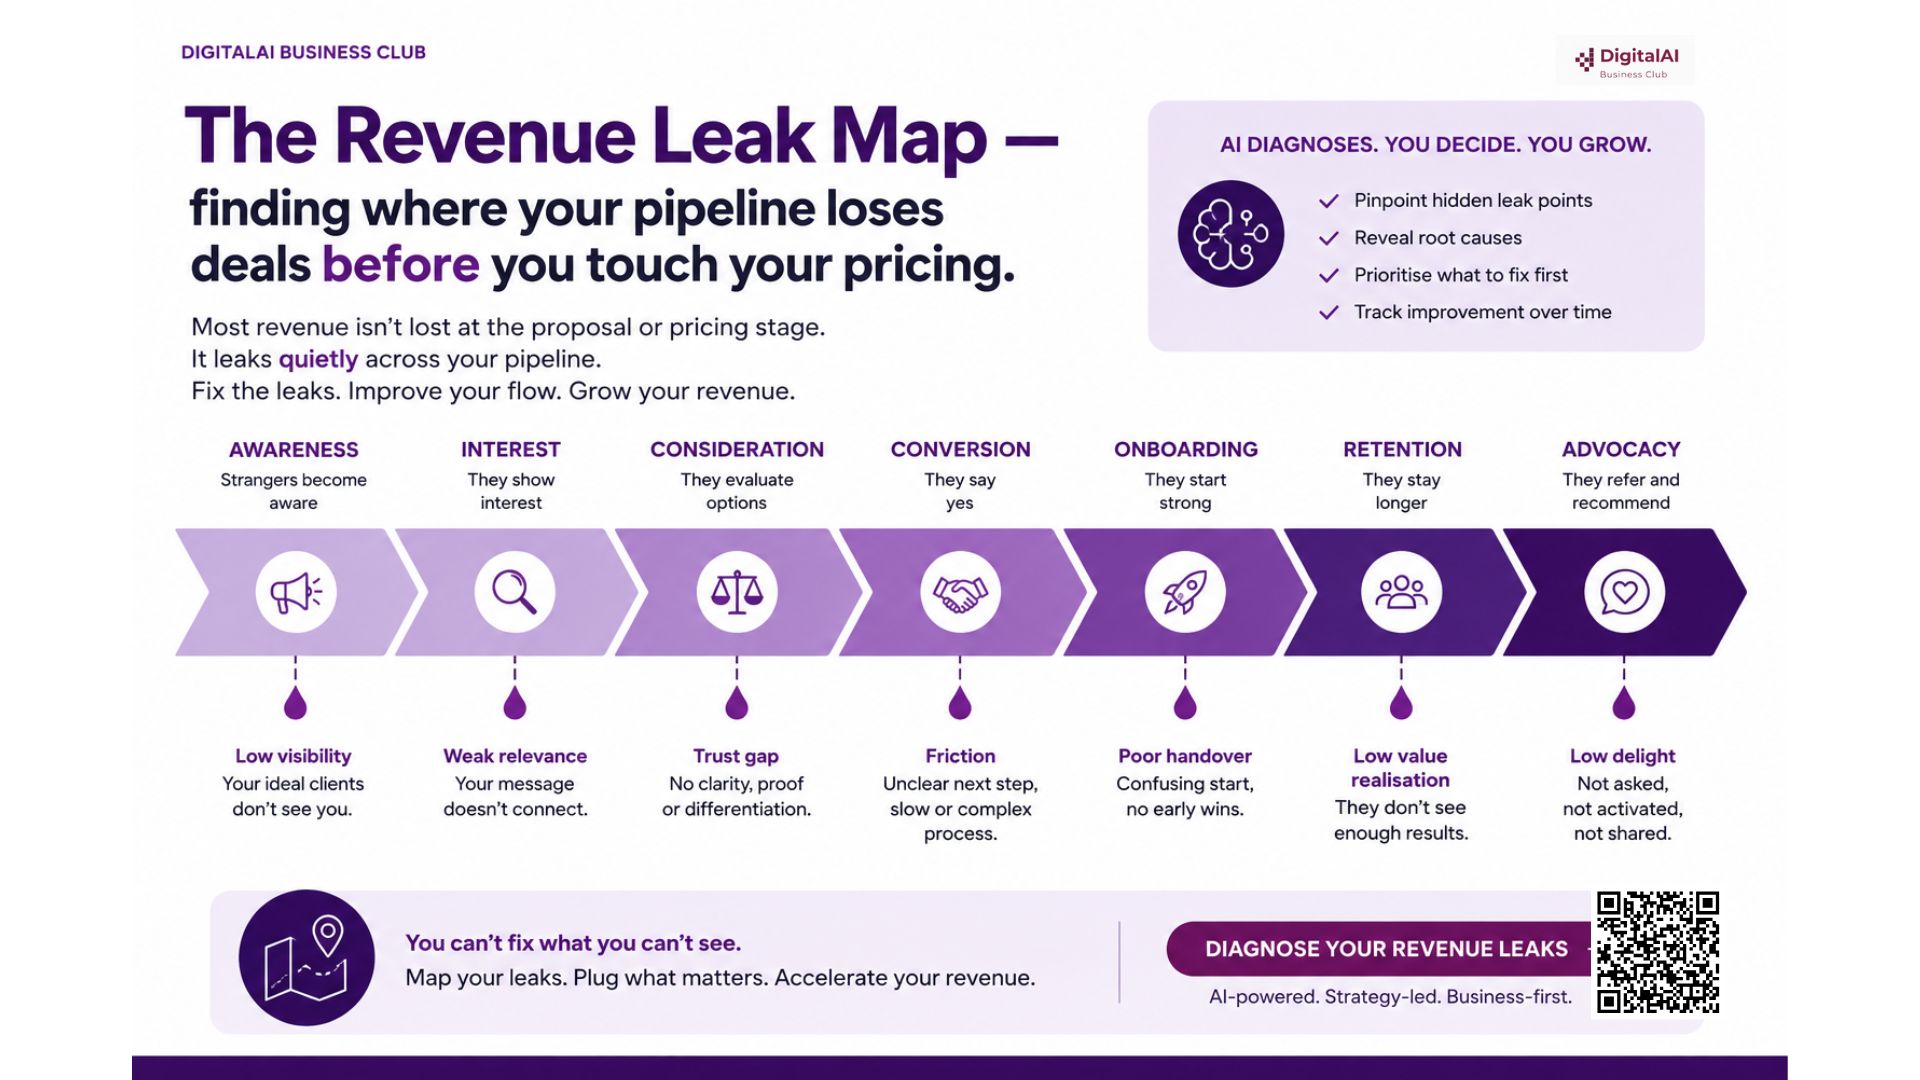
Most businesses don’t have a sales problem. They have a diagnosis problem. Before you hire another salesperson, discount your pricing, or add another AI tool, it’s worth asking a harder question: do you actually know where your pipeline is leaking revenue — or are you guessing?
Best Answer
A pipeline “leaks” revenue at specific, repeatable stages — slow response, unclear qualification, unresolved trust gaps, weak proposal follow-up, or an undefined close. Most SMEs never find these leaks because they measure sales by activity (calls made, quotes sent) instead of by stage-by-stage conversion. AI tools like Claude can’t fix a leaky pipeline for you, but when you feed them your enquiry history and lost-deal notes, they can help you spot the pattern in an afternoon — work that would normally take weeks of manual review.
A renovation contractor in Petaling Jaya once told me his close rate had dropped from 1-in-3 to 1-in-8, and his answer was to run more Facebook ads. More leads came in. The close rate stayed the same. He’d treated a diagnosis problem as a demand problem — and paid for it twice.
This article walks through the Revenue Leak Map™ — the five places most SME pipelines actually lose revenue — and how to use AI to find your own leak points before you spend another ringgit on lead generation.
Why This Is a Diagnosis Problem, Not a Sales Problem
When conversion drops, most business owners reach for the same three levers: more leads, more discounts, or more sales effort. All three assume the problem is volume or motivation. Very rarely is it either.
What actually happens is quieter. A prospect enquires on a Friday and gets a reply on Monday — and by then they’ve already spoken to a competitor. A proposal goes out with no follow-up sequence, so it sits in an inbox until it’s forgotten. A sales conversation never resolves the one objection the buyer actually cared about, so they go quiet instead of saying no.
None of these are sales problems in the traditional sense. They are pipeline design problems — specific, locatable, and fixable once you know where to look. That’s the shift: from “we need to sell harder” to “we need to know exactly where deals are stalling, and why.”
Revenue leaks are rarely about price. They’re about response time, clarity, and follow-through — the unglamorous parts of the pipeline nobody audits.
The Revenue Leak Map™: 5 Places Your Pipeline Is Leaking
The Revenue Leak Map™ breaks your customer journey into five stages, each with its own failure pattern. Most SME pipelines leak at more than one point — but usually two stages account for the majority of lost revenue.
| Stage | Leak Point | What It Looks Like |
|---|---|---|
| 1. Response | Slow or inconsistent lead response | Enquiries answered hours or days later; no set response-time standard; leads go cold before a human replies. |
| 2. Qualification | Unclear who’s actually a fit | Every enquiry gets the same pitch; time is spent on poor-fit leads; good-fit leads don’t feel understood. |
| 3. Trust | Unresolved objections or doubts | Prospects go quiet after a call; no proof, case examples, or answers to the doubts they’re too polite to voice. |
| 4. Proposal | Weak or missing follow-up | Proposal sent, then silence; no structured follow-up sequence; the deal simply fades rather than closes or dies. |
| 5. Close | Undefined closing process | No clear next step offered; decision left entirely to the buyer; deals stall in “let me think about it” indefinitely. |
Notice what’s missing from this list: pricing. Price is rarely the real leak — it’s usually the story the business owner tells themselves because it’s easier than auditing the first four stages.
Why Most SME Owners Miss These Leaks
Three reasons show up again and again in Malaysian and SEA SMEs:
1. Sales activity is tracked. Sales stages are not.
Most business owners can tell you how many quotes went out this month. Very few can tell you how long a lead sat before first contact, or at which stage the last ten lost deals actually died. Activity is visible. Stage-by-stage conversion usually isn’t — because nobody’s built the map to see it.
2. Lost deals are filed away, not reviewed.
A lost deal typically gets marked “not interested” and forgotten. The pattern hiding inside twenty lost deals — the same objection, the same hesitation, the same missed follow-up window — never gets surfaced, because nobody sits down to read them side by side.
3. The fix always defaults to “more.”
More leads. More content. More discounting. More hustle. It feels productive, and it avoids the harder, quieter work of asking: where exactly did the last twenty deals we lost actually stall?
The pattern to notice: A consulting firm in Bangsar wasn’t losing deals on price — 90% of their lost proposals had zero recorded follow-up after the first send. The leak wasn’t the offer. It was Stage 4.
Not Sure Where Your Pipeline Is Leaking?
Before you change your pricing, your offer, or your ad spend — find out where your customer journey is actually losing revenue. The Customer Journey & Profitability Diagnostic takes 10 minutes and shows you exactly which stage needs attention first.
Take the Free Diagnostic Join the Free WhatsApp CommunityHow to Diagnose Your Pipeline With AI: 3 Claude Prompts
AI cannot read your CRM on its own, and it cannot tell you where your pipeline leaks without data. What it can do — fast — is spot patterns across enquiries, calls, and lost deals once you give it the raw material. Below are three prompts built on the PRISM framework (Problem · Role · Instruction · Structure · Milestone), designed to move you from “I think we’re losing deals somewhere” to a named leak point with evidence behind it.
Export or paste in whatever you already have: a WhatsApp enquiry log, a spreadsheet of quotes sent, or notes on your last 15–20 lost deals. You don’t need a CRM to start.
Prompt 1: Lead Response Time Audit
Problem: I want to know if slow lead response is costing me deals.
Role: Act as a revenue operations analyst for a service-based SME.
Instruction: I will paste a list of enquiries with the date/time received
and the date/time we first replied. Calculate the average response time,
flag any enquiry where response took longer than 24 hours, and identify
whether slower responses correlate with lower conversion in the outcomes
I provide.
Structure: Present findings as a short table (Enquiry / Response Time /
Outcome), followed by a 3-sentence summary of the pattern.
Milestone: End with one specific response-time standard I should set
for my team, based on what the fastest-converting enquiries had in common.

[Paste your enquiry log here]
Use this first — response speed is the single most common leak point and the easiest to fix immediately.
Prompt 2: Lost Deal Pattern Finder
Problem: I have notes on our last 15-20 lost deals and I can't tell if
there's a pattern, or if every loss is a one-off.
Role: Act as a sales pipeline diagnostician for a Malaysian SME.
Instruction: Read through the lost-deal notes I provide. Group them by
the stage at which the deal died (first contact, after quote sent, after
proposal, after negotiation) and by the stated or implied reason
(price, trust, timing, no follow-up, went with competitor).
Structure: Output a summary table showing which stage and which reason
appears most often, then a short paragraph naming the single biggest
leak point across all the deals.
Milestone: Recommend one specific change to our follow-up process that
would address the most common leak.

[Paste your lost-deal notes here]
This prompt turns scattered “why we lost this one” notes into a single, ranked leak point — usually the most eye-opening step in the whole exercise.
Prompt 3: Build My Revenue Leak Map
Problem: I want a full picture of where my pipeline leaks across all
five stages: response, qualification, trust, proposal, and close.
Role: Act as my AI Strategy Coach, using the Revenue Leak Map framework
(response, qualification, trust, proposal, close).
Instruction: Based on the data and notes I've shared in this
conversation [or paste a summary of your pipeline], score each of the
five stages as Strong, Needs Attention, or Leaking, with one sentence
of evidence for each score.
Structure: Present as a simple table — Stage / Score / Evidence /
Recommended First Action.
Milestone: Tell me which ONE stage to fix first, and why fixing that
one stage first will have the biggest impact on revenue this quarter.
Run this last, after Prompts 1 and 2, so Claude has real evidence to work from rather than assumptions.
From Diagnosis to Action: The Leak-to-Fix Table
Diagnosis without action is just an interesting report. Once you know your leak point, the fix is usually smaller and cheaper than the “more leads” instinct suggests.
| If the leak is… | Start here |
|---|---|
| Response | Set a response-time standard (e.g. under 2 business hours) and use an AI-drafted first-reply template so speed doesn’t depend on who’s free. |
| Qualification | Write three qualifying questions every enquiry must answer before a proposal is prepared, so effort goes to the right-fit leads first. |
| Trust | Build a short proof pack — one case example, one FAQ answering the top objection — sent automatically after the first conversation. |
| Proposal | Create a fixed 3-touch follow-up sequence (Day 2, Day 5, Day 10) so no proposal fades from silence alone. |
| Close | End every proposal conversation with one explicit next step and date — never leave the close entirely to the buyer’s initiative. |
Fix one stage before moving to the next. Trying to repair all five at once usually means none of them get done properly.
Frequently Asked Questions
What is a revenue leak in a sales pipeline?
A revenue leak is a stage in your customer journey where qualified prospects stall, go quiet, or walk away — not because your offer is wrong, but because something at that stage isn’t working. Most businesses lose revenue at these leak points long before they ever question their pricing or product.
How is a revenue leak different from a sales problem?
A sales problem assumes the issue is effort, skill, or luck. A revenue leak assumes the issue is a specific, identifiable point in the pipeline where prospects consistently drop off. Diagnosing the leak tells you exactly what to fix; treating it as a generic sales problem usually leads to more activity without more conversion.
Can AI actually diagnose where my pipeline is leaking?
Yes, when you give it the right inputs. AI tools like Claude cannot see your CRM on their own, but when you feed them your lead response times, lost-deal notes, and proposal follow-up patterns, they can spot recurring stall points and help you build a structured Revenue Leak Map far faster than reviewing deals manually.
What are the most common pipeline leak points for SMEs?
The five most common are: slow lead response, unclear qualification, unresolved trust or objection gaps, weak proposal follow-up, and an undefined closing process. Most SMEs lose more revenue to the first two — slow response and unclear qualification — than to pricing.
Do I need a CRM before I can diagnose my revenue leaks?
No. You can start with what you already have — WhatsApp chat history, an enquiry spreadsheet, or your last 20 lost deals. A CRM makes ongoing tracking easier, but the first diagnosis can be done manually with AI support before you invest in new tools.
Where should I start if I think my pipeline is leaking revenue?
Start by mapping your last 15–20 enquiries against the five leak points in this article, not by buying a new tool. Once you know where deals are actually stalling, the right AI use case becomes obvious — and often much smaller than you expected.
Your Pipeline Doesn’t Need More Leads. It Needs a Diagnosis.
The Revenue Engine module inside the AI Customer Profit Engine Bootcamp walks you through building your own Revenue Leak Map, drafting your AI diagnostic prompts, and designing the fix for your highest-leverage leak point — step by step, with Jane.
Explore the Bootcamp Join DigitalAI Strategy Vault Membership