
AI Maturity, Benchmarked: How Do You Really Compare?

The short version: The AI Maturity Self-Assessment just got a second layer. Instead of only telling you which of the 5 stages you’re on, it now benchmarks you against real industry averages — so “I scored 60” turns into “I scored 60, and my industry averages 55.” This feature is in soft launch. I’m asking a small group to test it first, including me.
Best Answer
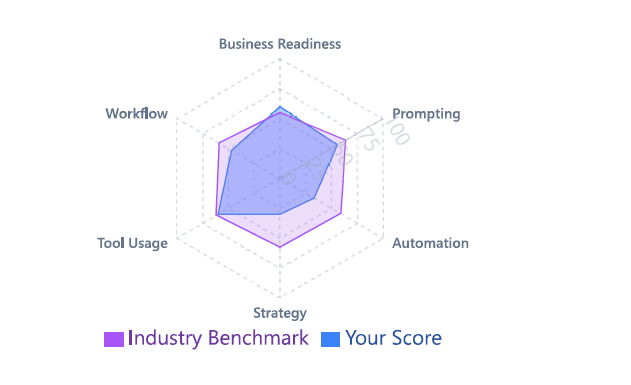
The updated AI Maturity Assessment now plots your score against an industry benchmark across six areas — Business Readiness, Prompting, Automation, Strategy, Tool Usage and Workflow — using a radar chart and a side-by-side bar comparison. It’s free, takes about two minutes, and needs no login. It’s currently in soft launch, so early testers get a direct line to shape the public version.
A few weeks ago I published the 5-stage AI maturity ladder — the idea that your AI skill isn’t measured by which tool you use, but by how deeply that tool is embedded in how you actually run your business. It landed well. But it also surfaced one question I couldn’t answer with a table: “Okay, I scored a 6. Is that good?”
A number on its own doesn’t tell you anything. A number next to your industry’s average does. So that’s what I built next.
In This Article
The 5-Stage Ladder, Rewritten
Two people can use the exact same AI tool and sit at completely different stages of maturity. One retypes their business background into every new chat. The other has a tool that already knows their offer, their customer, their tone — and runs a process the same way every time. Same subscription, worlds apart in what it’s actually doing for the business. Here’s the ladder in full:
If you want the full breakdown — including the self-assessment prompt and what each stage is quietly costing you — that’s covered in the original article: AI Maturity Self-Assessment: Which Stage Are You Really At? This post picks up from there.
What’s New: Real Industry Benchmarking
The ladder tells you your stage. It doesn’t tell you whether you’re ahead of, level with, or behind the businesses you actually compete with. That’s the gap the new feature closes.
After you complete the assessment, you now get two views of your result instead of one:
- A radar chart across six dimensions — Business Readiness, Prompting, Automation, Strategy, Tool Usage and Workflow — with your score plotted directly against the industry benchmark shape, so gaps are visible at a glance rather than buried in a paragraph.
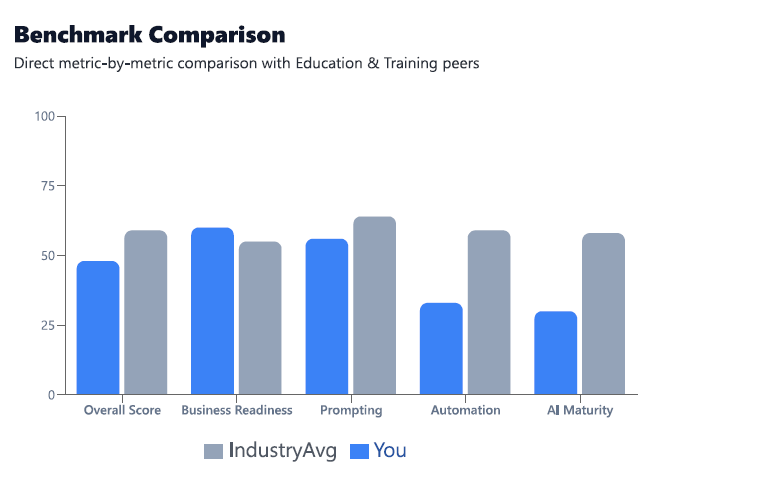
- A benchmark comparison chart that lines your score up bar-by-bar against the average for your sector, across Overall Score, Business Readiness, Prompting, Automation and AI Maturity.
Neither view tells you what to think about your score. Both just show you where it sits — which is the point. Diagnose first, decide second.
Be One of the First to Try It
The benchmark feature is in soft launch. Take the assessment, see your result against your industry, and tell me what you find.
Take the Assessment — 2 MinutesHow to Read Your Benchmark Result
Once your result loads, resist the urge to react to the overall score first. Read it dimension by dimension instead — Business Readiness, Prompting, Automation, Strategy, Tool Usage and Workflow all move independently, and that’s exactly where the useful information is.
In practice, most results aren’t uniformly good or bad. It’s common to see one or two dimensions sitting comfortably above the industry line — often Business Readiness, since that’s the area most people have consciously worked on — while others, especially Automation and overall AI Maturity, land behind. That gap is the whole point of the exercise: it’s exactly the pattern the original ladder article warned about. Confidence with prompting is not the same as depth of use, and a benchmark will surface that faster than a self-rating ever will.
The honest takeaway: the overall score is rarely the interesting part. Which single dimension is furthest behind — that’s what tells you what to fix first.
You’re Testing This Before Anyone Else
This feature hasn’t gone out to the wider DigitalAI community yet. If you’re reading this, you’re getting it early — which means your feedback genuinely shapes what ships next.
Once you’ve run through it, three things would help:
- Did your result feel accurate, or did something feel off?
- Was the benchmark clear, or confusing?
- What would make it more useful before it goes live for everyone?
Reply, comment, or message me directly — whichever is easiest.
What to Do With Your Result
Wherever your score lands, the move is the same one from the original ladder article: diagnose before you automate, and fix the lowest-scoring area first rather than trying to close every gap at once.
| If you’re behind on | Do this first |
|---|---|
| Business Readiness | Get one tool set up with proper business memory before adding anything else |
| Prompting | Turn your most-repeated request into a saved, reusable prompt instead of rewriting it each time |
| Automation | Connect one repeatable process to real business data — calendar, CRM, documents — instead of only what you type |
| AI Maturity (overall) | Pick the single lowest score, not the average, and work on that one thing for the next 30 days |
If your gap is in Skills, Connectors, or Cowork-level delegation specifically, that’s the exact staged path the Claude AI for Business 3-Level Training Pathway is built to close.
Frequently Asked Questions
What is the AI Maturity Benchmark feature?
It’s an update to the AI Maturity Self-Assessment that scores your AI usage across six areas — Business Readiness, Prompting, Automation, Strategy, Tool Usage and Workflow — and plots your result against an industry average, instead of only giving you a standalone score.
How is my score compared to an industry average?
After you complete the assessment, your results are shown on a radar chart and a bar chart next to the average score for businesses in a similar sector, so you can see exactly which areas you’re ahead on and which are behind, metric by metric.
Do I need to create an account to see my benchmark?
No. The assessment is free to take and does not require a login. You answer a short set of questions and your personal-versus-benchmark result appears immediately.
What should I do if my score is below the industry average?
Treat it as a starting point, not a verdict. Identify the single lowest-scoring area, fix that one thing first — usually moving from re-typing context every session to a tool that remembers your business — and re-check your score in a month rather than trying to close every gap at once.
Is this the same as the DigitalAI Readiness Assessment?
They’re related but distinct. The DigitalAI Readiness Assessment looks at broader business digitalisation. This tool is specifically about AI maturity — how deeply AI is embedded in the way you actually work — and is currently in soft launch.
Keep the Momentum Going
Wherever you land on the ladder, DigitalAI Strategy Membership gives you the frameworks, skills and monthly AI guidance to move up it — deliberately, not by accident.
Join DigitalAI Strategy Membership Take the Assessment First